Time Series Data Service
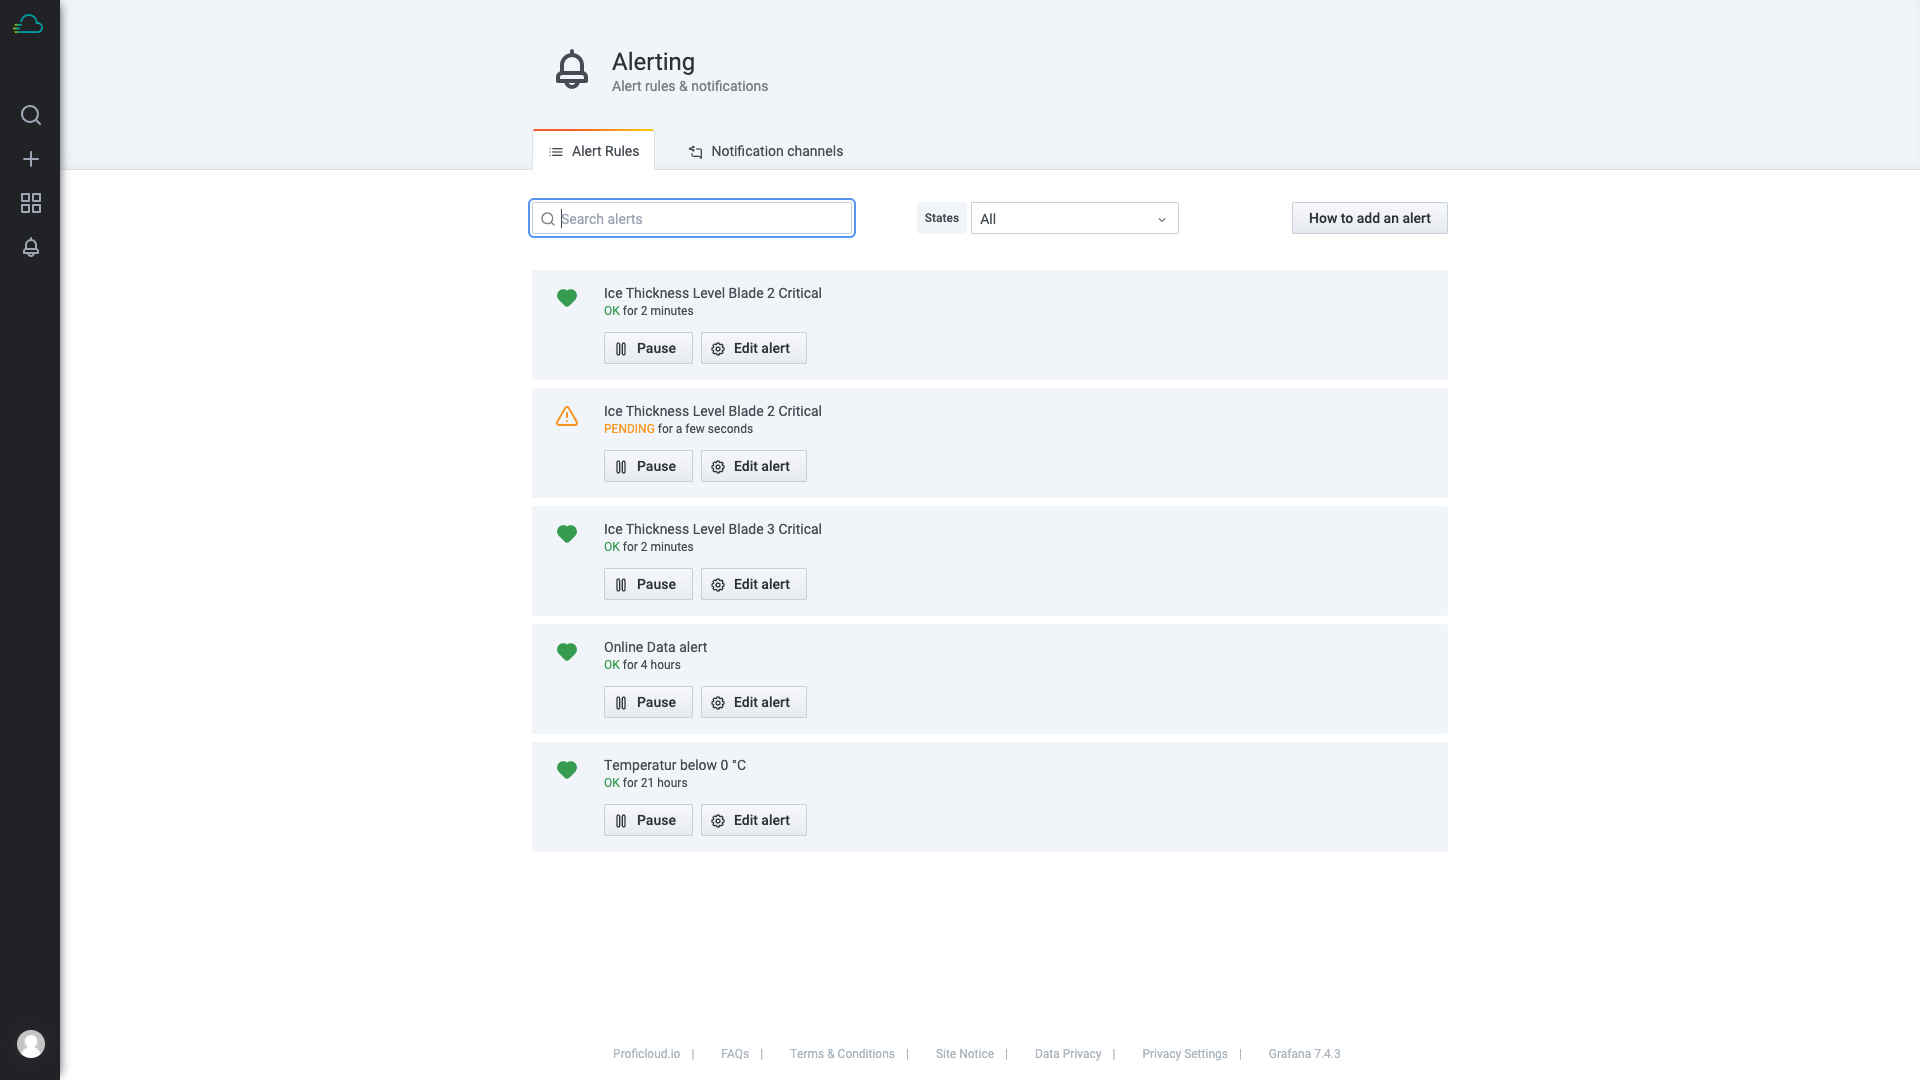
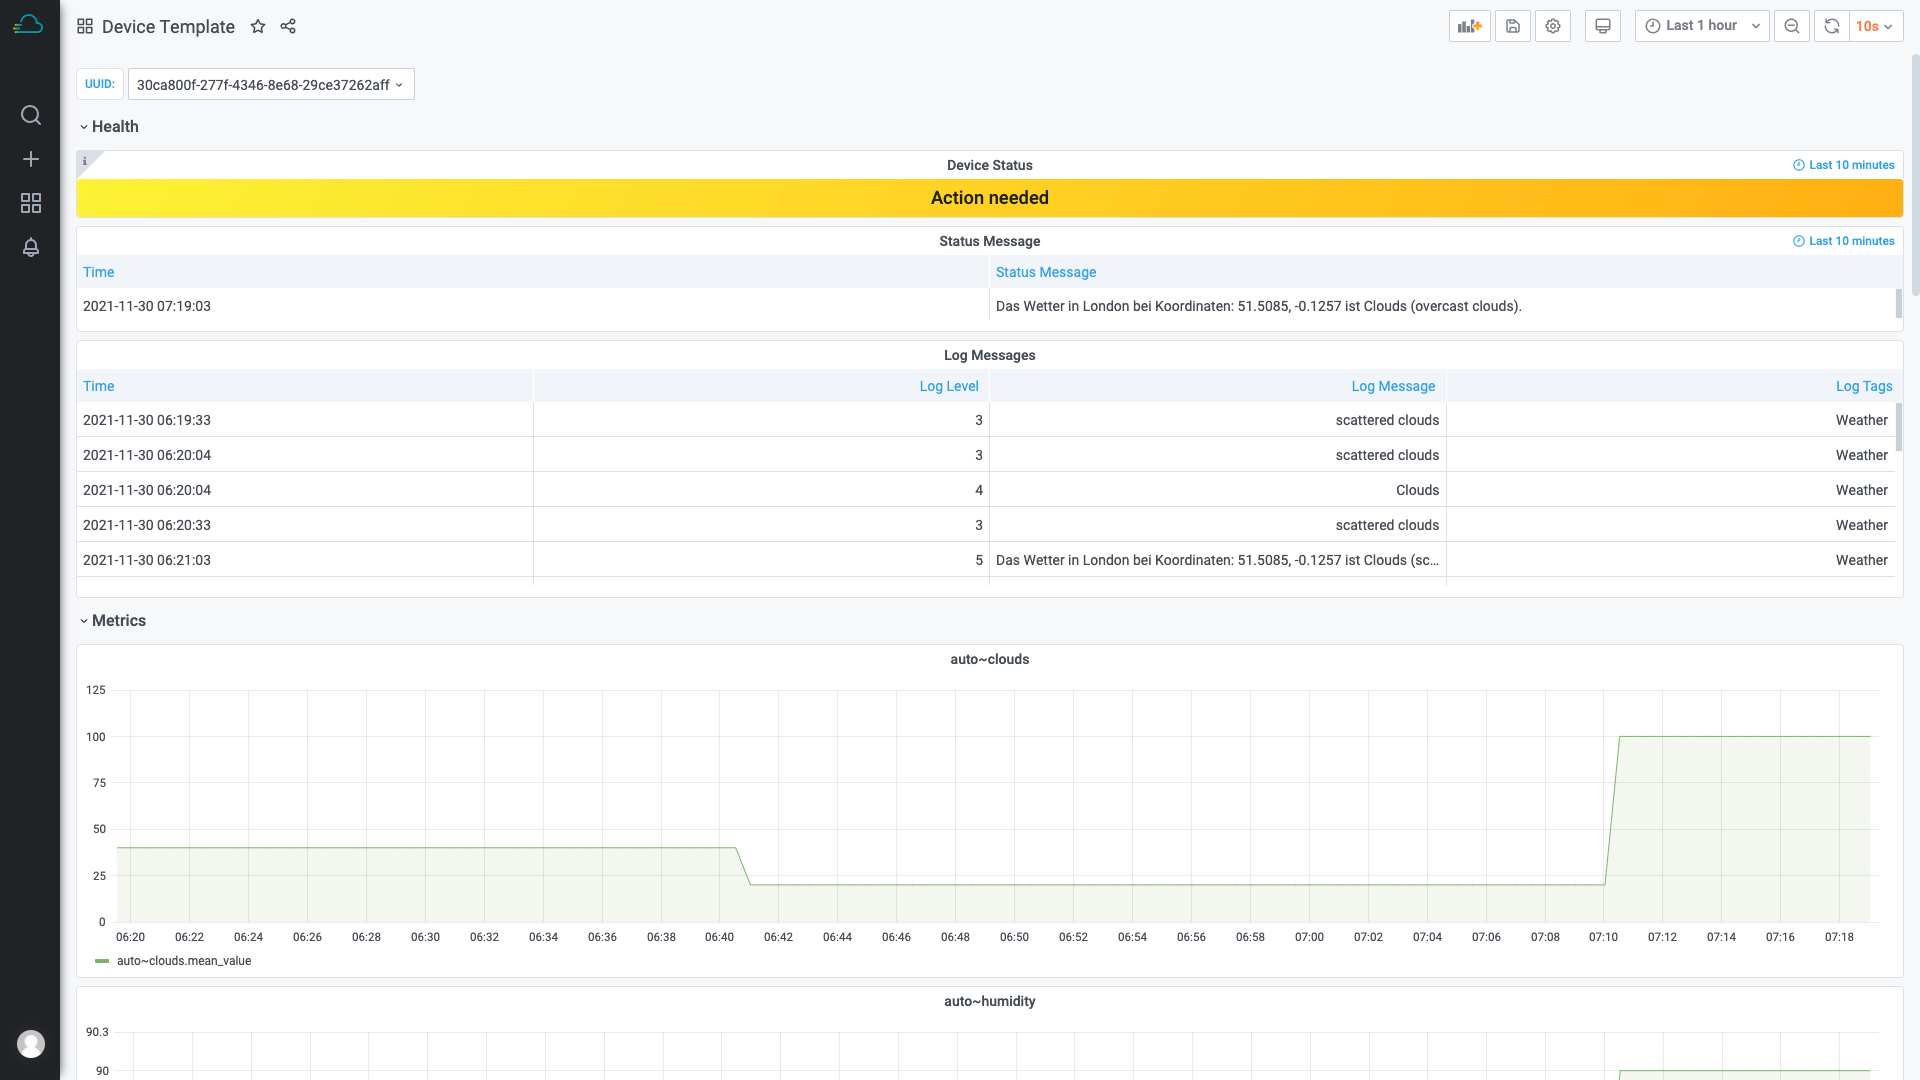
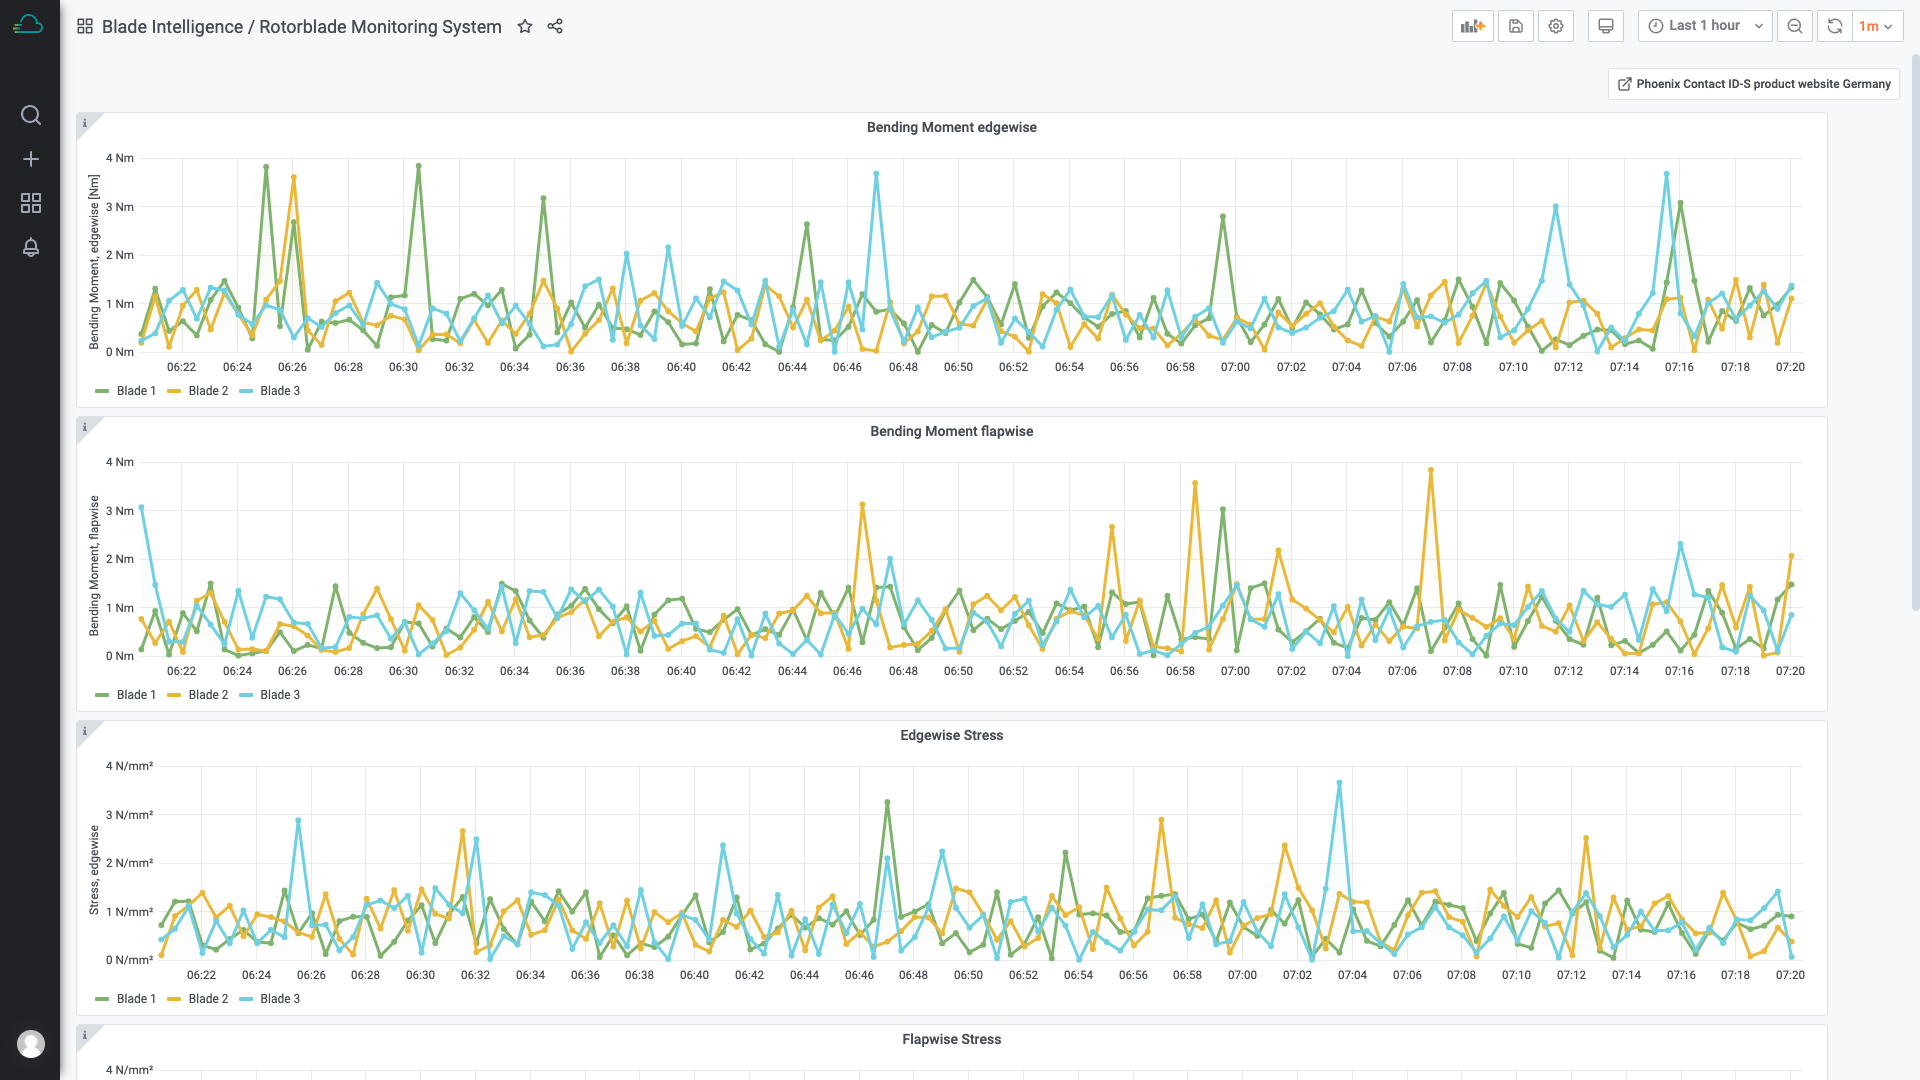
With Time Series Data Service, you can monitor and track the process data of your plant. This creates the basis for predictive maintenance and other big-data applications. Web-based dashboards give you access to your data anytime, anywhere. You decide for yourself what you want to use it for.
Starts at € 0.00
Pricing of the Time Series Data Service
TSD Free
€ 0
per year
Test Package, no billing details required
- 20 Metrics
- 0.0 € / Metric
- Metrics are sent once per second to Proficloud.io
- Data will be compressed after 1 year
- Integrated alerting
Time Series Data 50
€ 300
per year¹
Beginner-friendly
- 50 Metrics
- 6.00 € / Metric
- Metrics are sent once per second to Proficloud.io
- Data will be compressed after 1 year
- Integrated alerting
Time Series Data 100
€ 500
per year¹
Small scenarios/p>
- 100 Metrics
- 5.00 € / Metric
- Metrics are sent once per second to Proficloud.io
- Data will be compressed after 1 year
- Integrated alerting
Most popular
Time Series Data 200
€ 900
per year¹
Basic package
- 200 Metrics
- 4.50 € / Metric
- Metrics are sent once per second to Proficloud.io
- Data will be compressed after 1 year
- Integrated alerting
Time Series Data 500
€ 1800
per year¹
Extended Package | Save up to 20 %
- 500 Metrics
- 3.60 € / Metric
- Metrics are sent once per second to Proficloud.io
- Data will be compressed after 1 year
- Integrated alerting
¹ excluding taxes
New functionalities of the Time Series Data Service
July 2023, Update from 01/07/2023
As a user, you do not need to perform any manual actions to use the update, the Smart Service (Time Series Data Service) you are using will automatically update itself to the latest version.
What’s new?
- New entry point
- Faster link to FAQs, All dashboards, User Guides
- New tutorial on how to set an individual dashboard as a home dashboard
April 2022, Update from 24/04/2022
As a user, you do not need to perform any manual actions to use the update, the Smart Service (Time Series Data Service) you are using will automatically update itself to the latest version.
What’s new?
- General design changes to achieve usability and future compatibility
- The Smart Services Device Management Service and Time Series Data Service are brought even closer together by a new plug-in
- The new “DMS Map” plugin displays an interactive map in the Time Series Data Service with the positions of the devices from the Device Management Service
- Each marked position on the map provides more information about the device located there (UUID, device name, location, tags, link to the device template) optionally another arbitrary link can be added
- The map can be filtered by the tags from the Device Management Service, e.g. only devices with the tag “Berlin” can be displayed on the map.
February 2022, Update from 09/02/2022
As a user, you do not need to perform any manual actions to use the update, the Smart Service (Time Series Data Service) you are using will automatically update itself to the latest version.
What’s new?
- General design changes to achieve usability and future compatibility
- Availability of a new plugin – the “Annotation List” plugin.
- Annotations can now be displayed in a list in an individual panel
- Annotations can be tagged with message, tag, time and user to achieve maximum transparency
- A click on the annotation changes the displayed time period to a certain value before and after the annotation (e.g. 10 minutes before, 10 minutes after)
April 2021, Update from 01/04/2021
As a user, you do not need to perform any manual actions to use the update, the Smart Service (Time Series Data Service) you are using will automatically update itself to the latest version.
What’s new?
- General design changes to achieve usability and future compatibility
- Possibility to use dark and light themes
- Configurable home dashboards
- New setting options for time zones within the panels
- New plugins available (WorldMap, Ace SVG)
- All plugins have been updated to the latest version
Since the Imagelt plugin has been updated to its latest version, the background images need to be relinked.
May 2020, Update from 15/05/2020
- Device independent standard dashboard for all Proficloud.io compatible devices
- Ability to create custom dashboards with the metrics that devices send to Proficloud.io
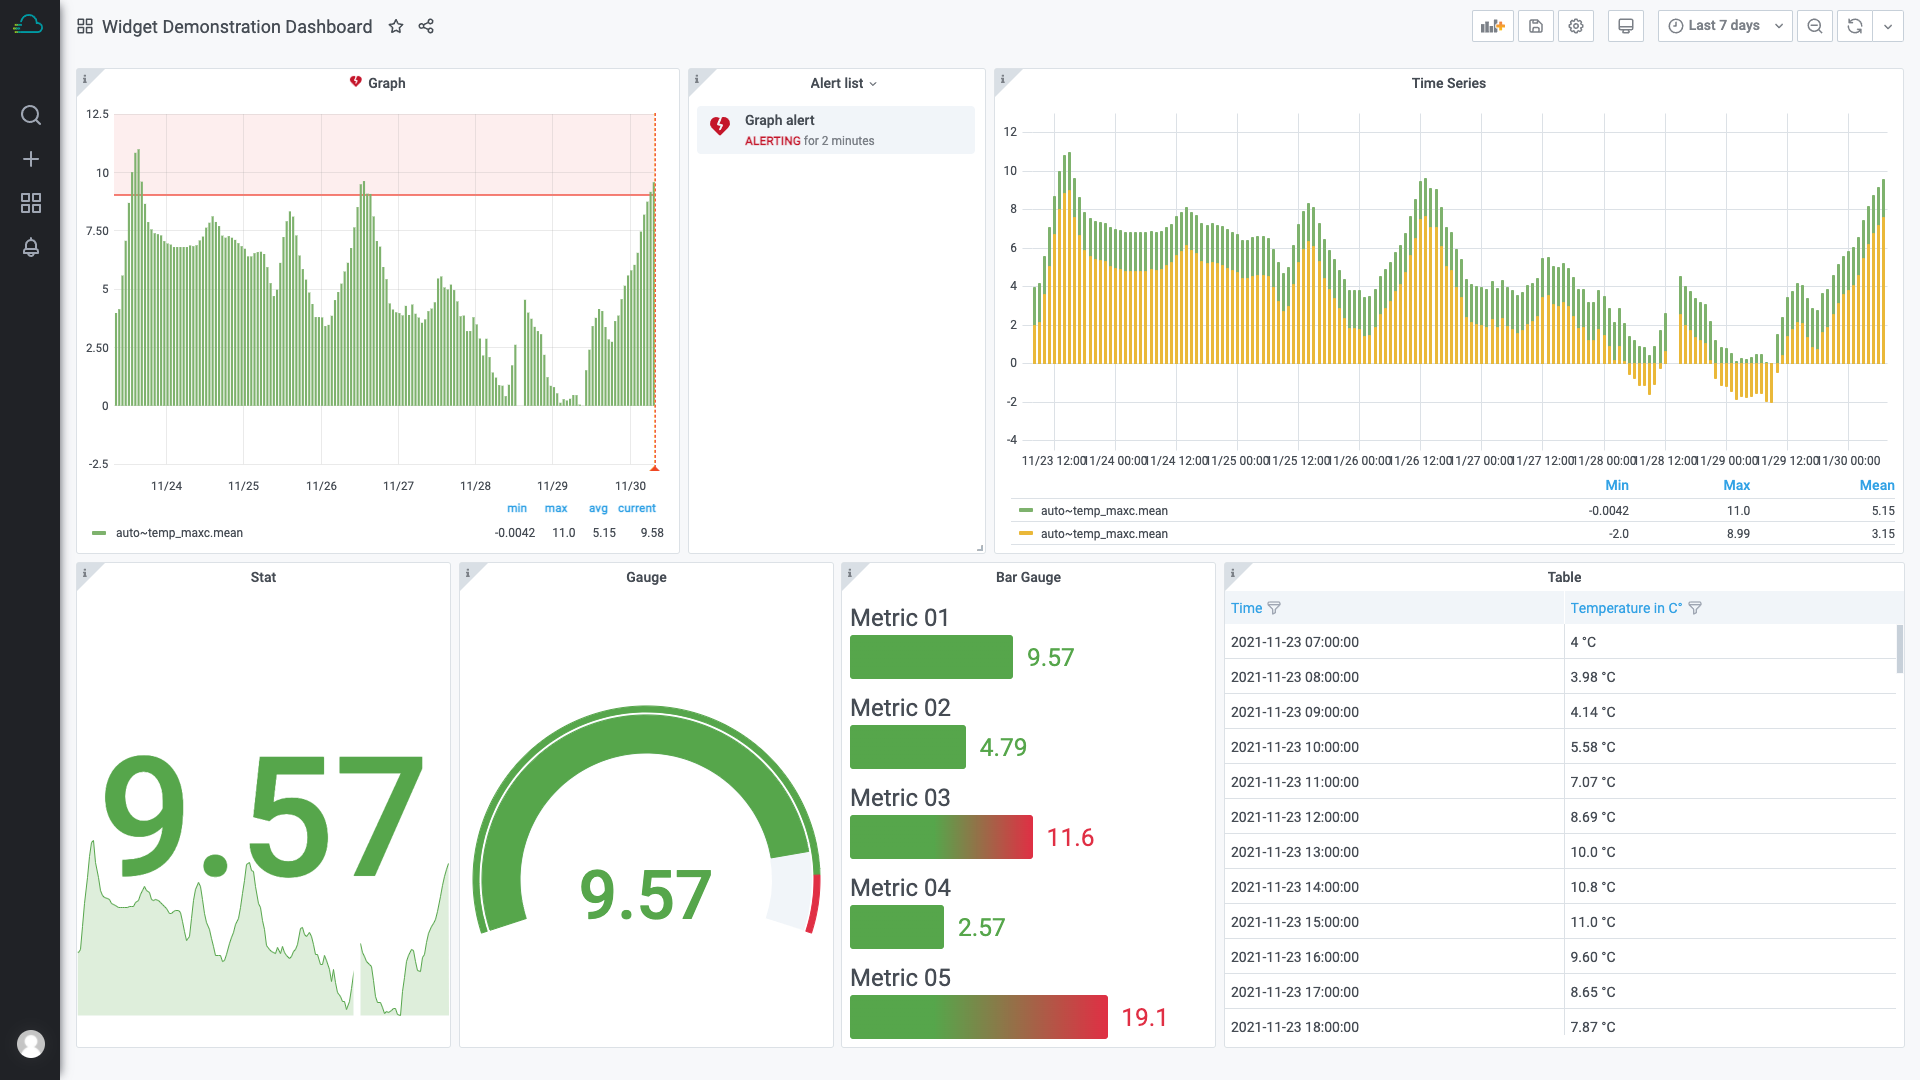
- Diverse visualization options (graphs, stats, gauge, bar gauge, table, text, heat maps …)
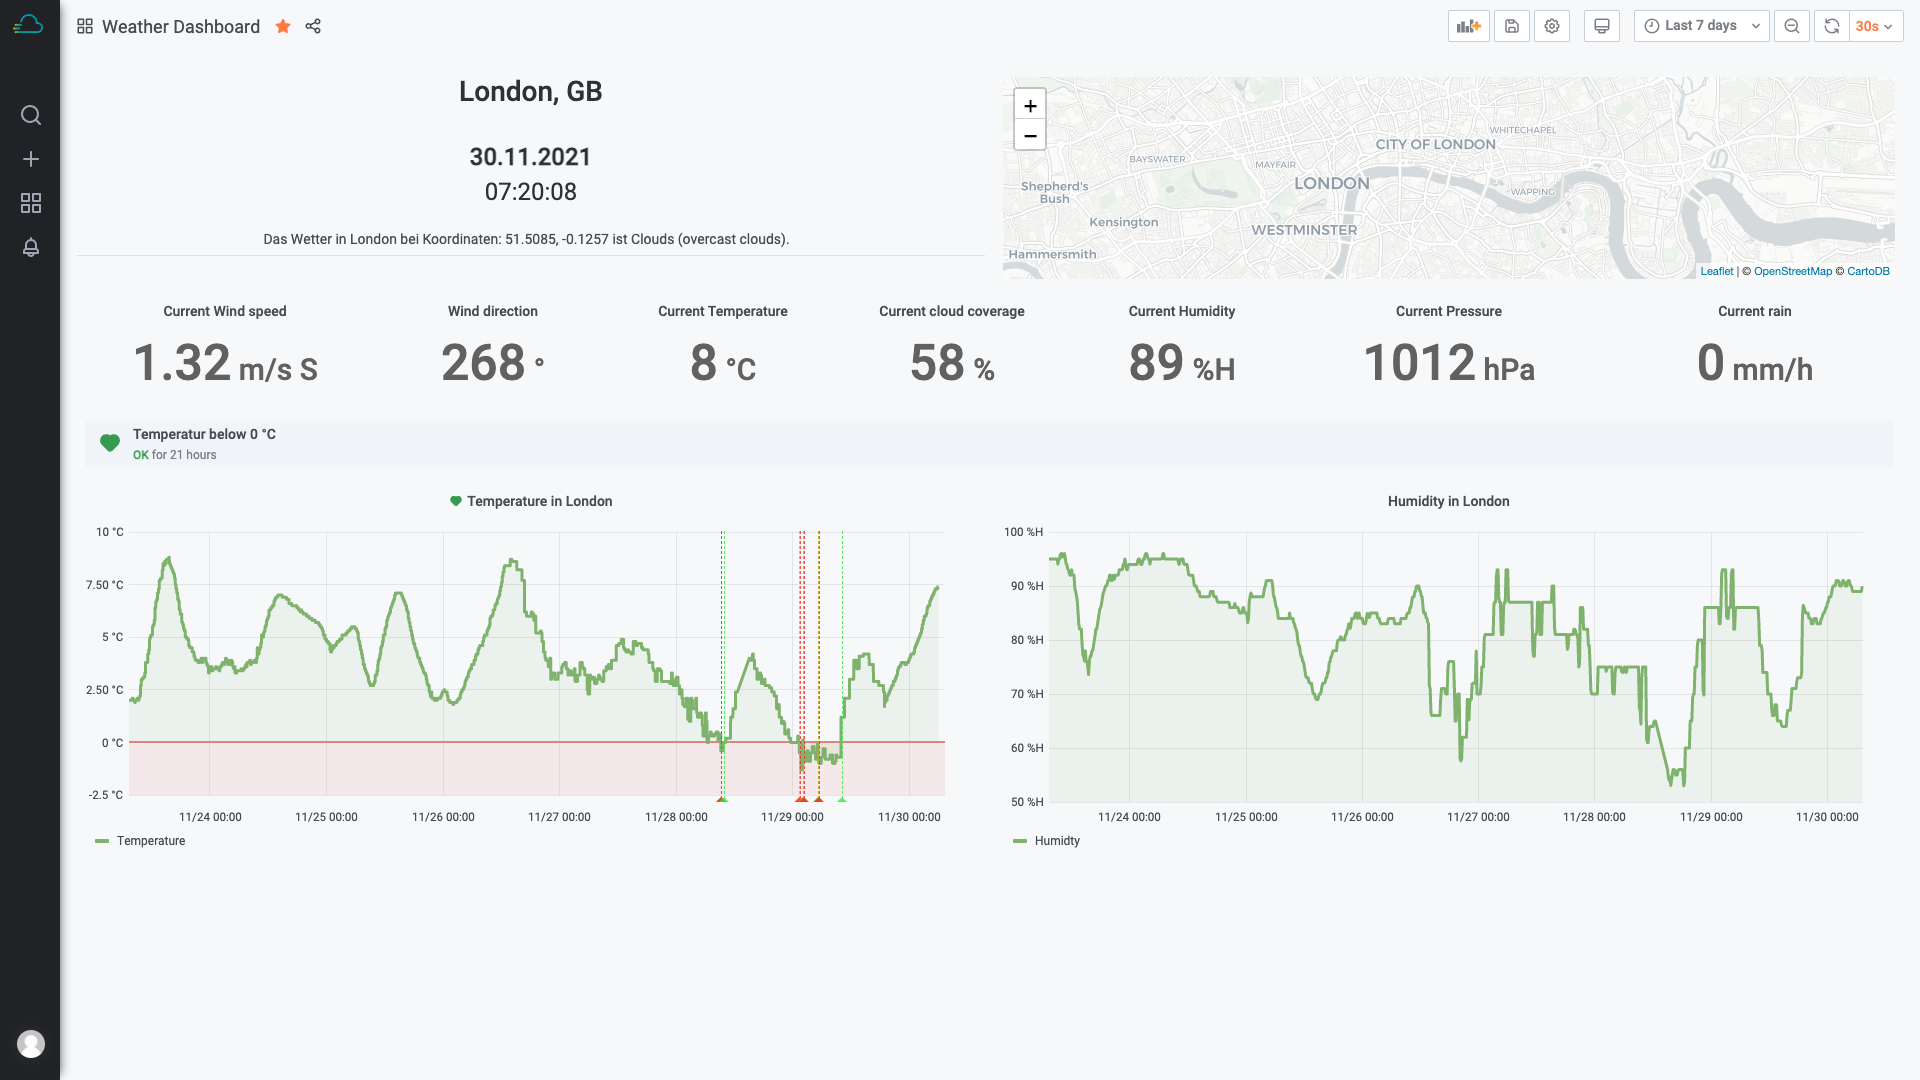
- Possibility to display data from different devices in one dashboard
- Possibility to set up different thresholds within the dashboards
- Naming and description of all dashboards and their associated panels
- Possibility to set up aliases for better readabilityAnnotate data in dashboards
May 2020, Update from 01/05/2020
- Device independent standard dashboard for all Proficloud.io compatible devices
- Ability to create custom dashboards with the metrics that devices send to Proficloud.io
- Diverse visualization options (graphs, stats, gauge, bar gauge, table, text, heat maps …)
- Possibility to display data from different devices in one dashboard
- Possibility to set up different thresholds within the dashboards
- Naming and description of all dashboards and their associated panels
- Possibility to set up aliases for better readabilityAnnotate data in dashboards
About the Time Series Data Service
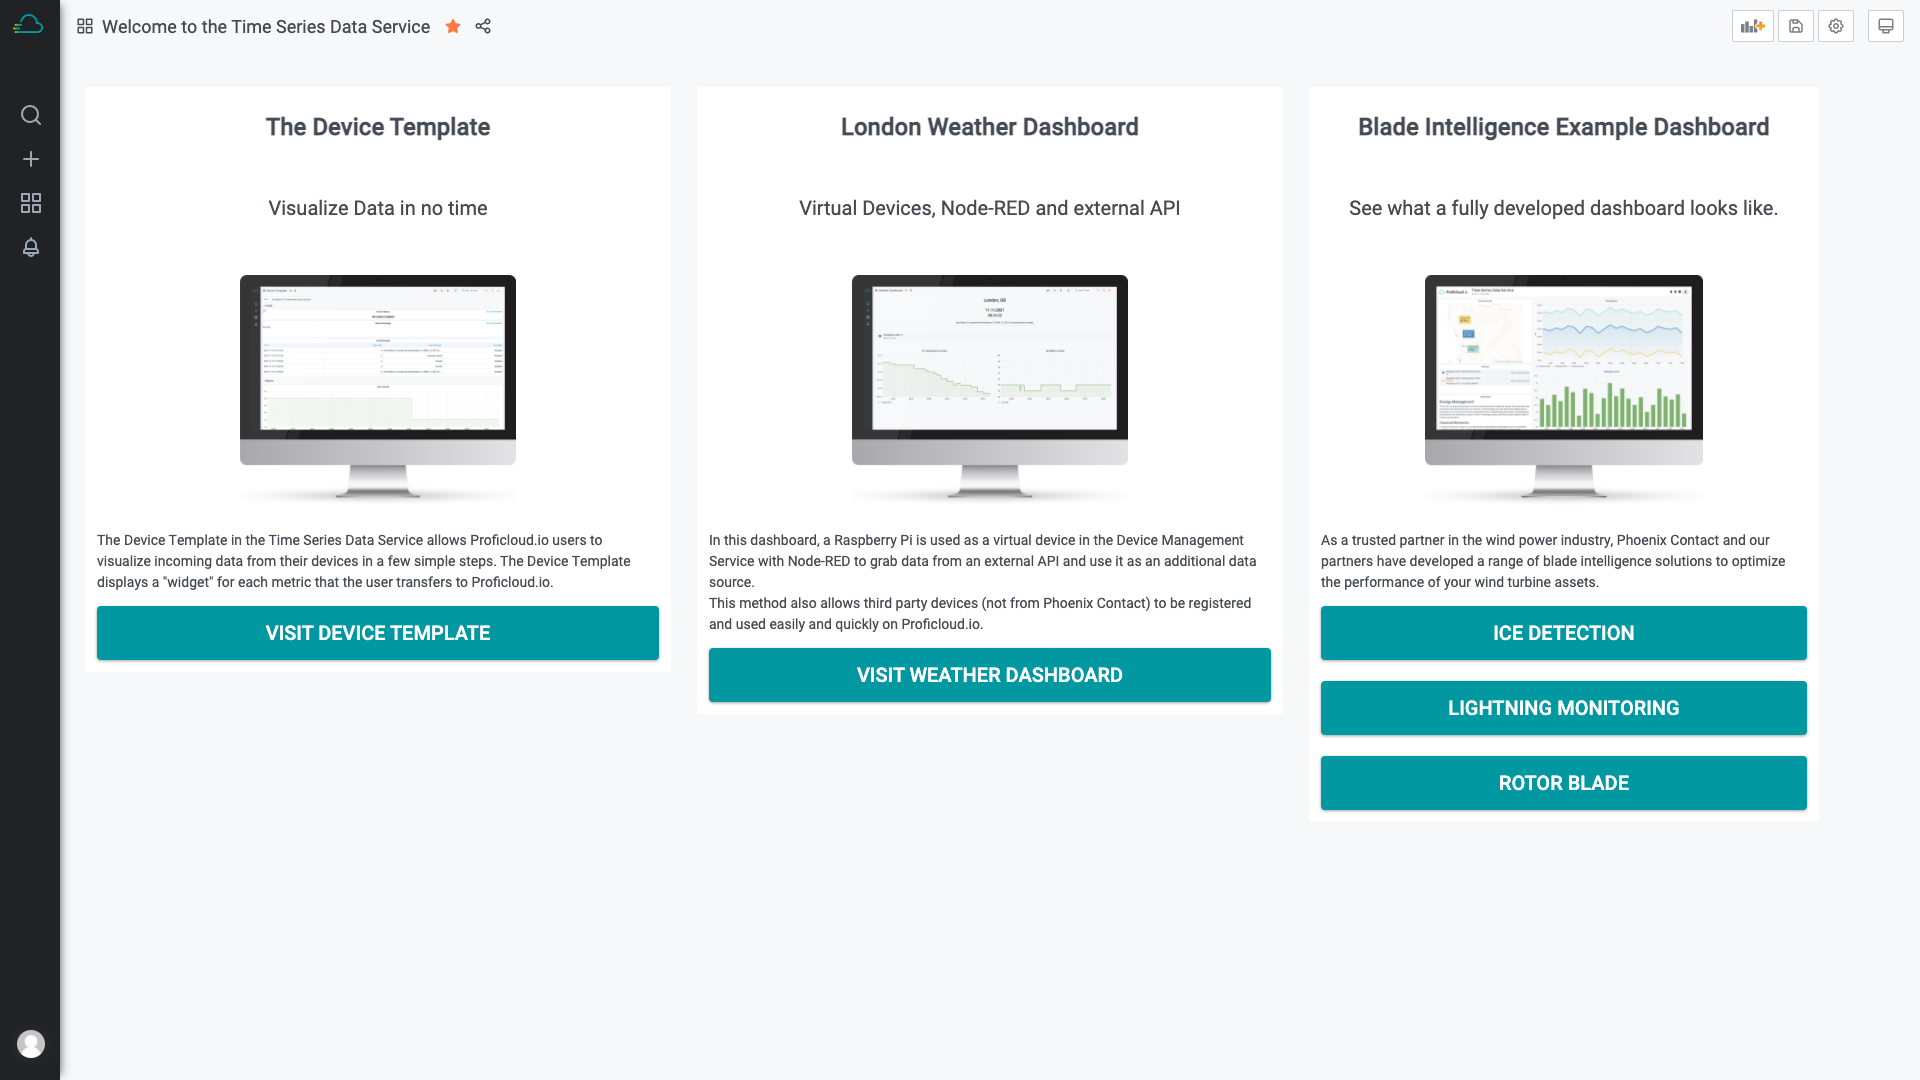
The Proficloud TSD (time series data) service is an easy and quick way of visualizing time series data.
Using our dashboarding system, you can create your own dashboards and visualizations without the need to actually program anything. Creating a new dashboard can be done within a few minutes and it’s as easy as choosing the visualization and the metric you want to display.
The Time Series Data Service also features an alerting feature, which can help notify your staff about problems with your machines and systems. The Proficloud.io Time Series Data Service can be evaluated for free, without the need to provide any payment information.

