Proficloud.io’s EMMA Service
The EMMA Service (Energy, Monitoring, Management, Analytics) is tailored to the needs of Energy Managers. It provides a plethora of visualization options to help understand energy data beautifully.
Starts at € 36.00
Pricing of the EMMA Service
Get started
EMMA 2
€ 36
per year / device¹
- 2 years data retention
- 8 visualization options including statistical values
- Highly intuitive user-guidance
EMMA Upgrade 5
€ 60
per year / device¹
- 5 years data retention
- 8 visualization options including statistical values
- Highly intuitive user-guidance
¹ excluding taxes
New functionalities of the EMMA Service
- Division into Metering Points (administrative units) and Metrics (actual data)
- Metering Points and Metrics can be nested and thus form a tree view
- Tree view can be used to reflect real properties in the EMMA Service
- Metering Points and Metrics can be moved and sorted via drag and drop
- Metering Points can be collapsed to ensure better clarity
- Every Metric can only be used once in the Metrics overview and in the Metering Points
- Total number of Metrics are displayed on the right side of the Metering Points, clicking on the number allows adding new Metrics to this Metering Point
- Individual names, colors, and icons can be assigned to Metering Points (e.g. map marker, building, sensor, etc.) to create better clarity
- Individual colors and names can be assigned to Metrics
- Summation feature will be discontinued in the future and replaced by automatic summation in Metering Points
- Metrics within a Metering Point are automatically summed up and can be used as a total in dashboards
- New representation for energy meters and calculated meters
- Metrics (values from energy meters) have their own area
- Metric Inbox added, here all unused, available metrics (data flows) are displayed
- Metrics and Metering Points
- Metering points and metrics can be represented in a nested manner, creating a tree view.
- The tree view can be used to reflect real properties in the EMMA service.
- Metering points and metrics can be moved and sorted using drag and drop.
- Metering points can be collapsed to ensure better visibility.
- Improved search feature with autofill and jump to selected entry
- Added possibility of creating new meters as KPIs with different mathematical functions (e.g. meter_1 + meter_2; meter_2 * 0.675 …)
- Individual units can be added to KPI meters
- Improved time picker for dashboards and widgets
- Overall performance improvements
- New media available in the EMMA Service (e.g. Water, Gas, Hot/Cold Thermal Energy, Steam)
- Energy meters can be individualized based on media
- Energy meters can be edited while being used
- Links to last time where data was received
- Minor bug fixes
- Creation of alerts possible
- Different triggers (hourly, daily, weekly) possible
- Alerts are divided into three different levels: Information, Attention, Alert
- Notification inside of Proficloud.io
- Creation of alerts possible
- Different triggers (hourly, daily, weekly) possible
- Alerts are divided into three different levels: Information, Attention, Alert
- Notification inside of Proficloud.io
- Import data as virtual device as CSV files
- Possibility of Reports with EnPIs
- Insight into total consumption over days, weeks or months
- Export as PDF
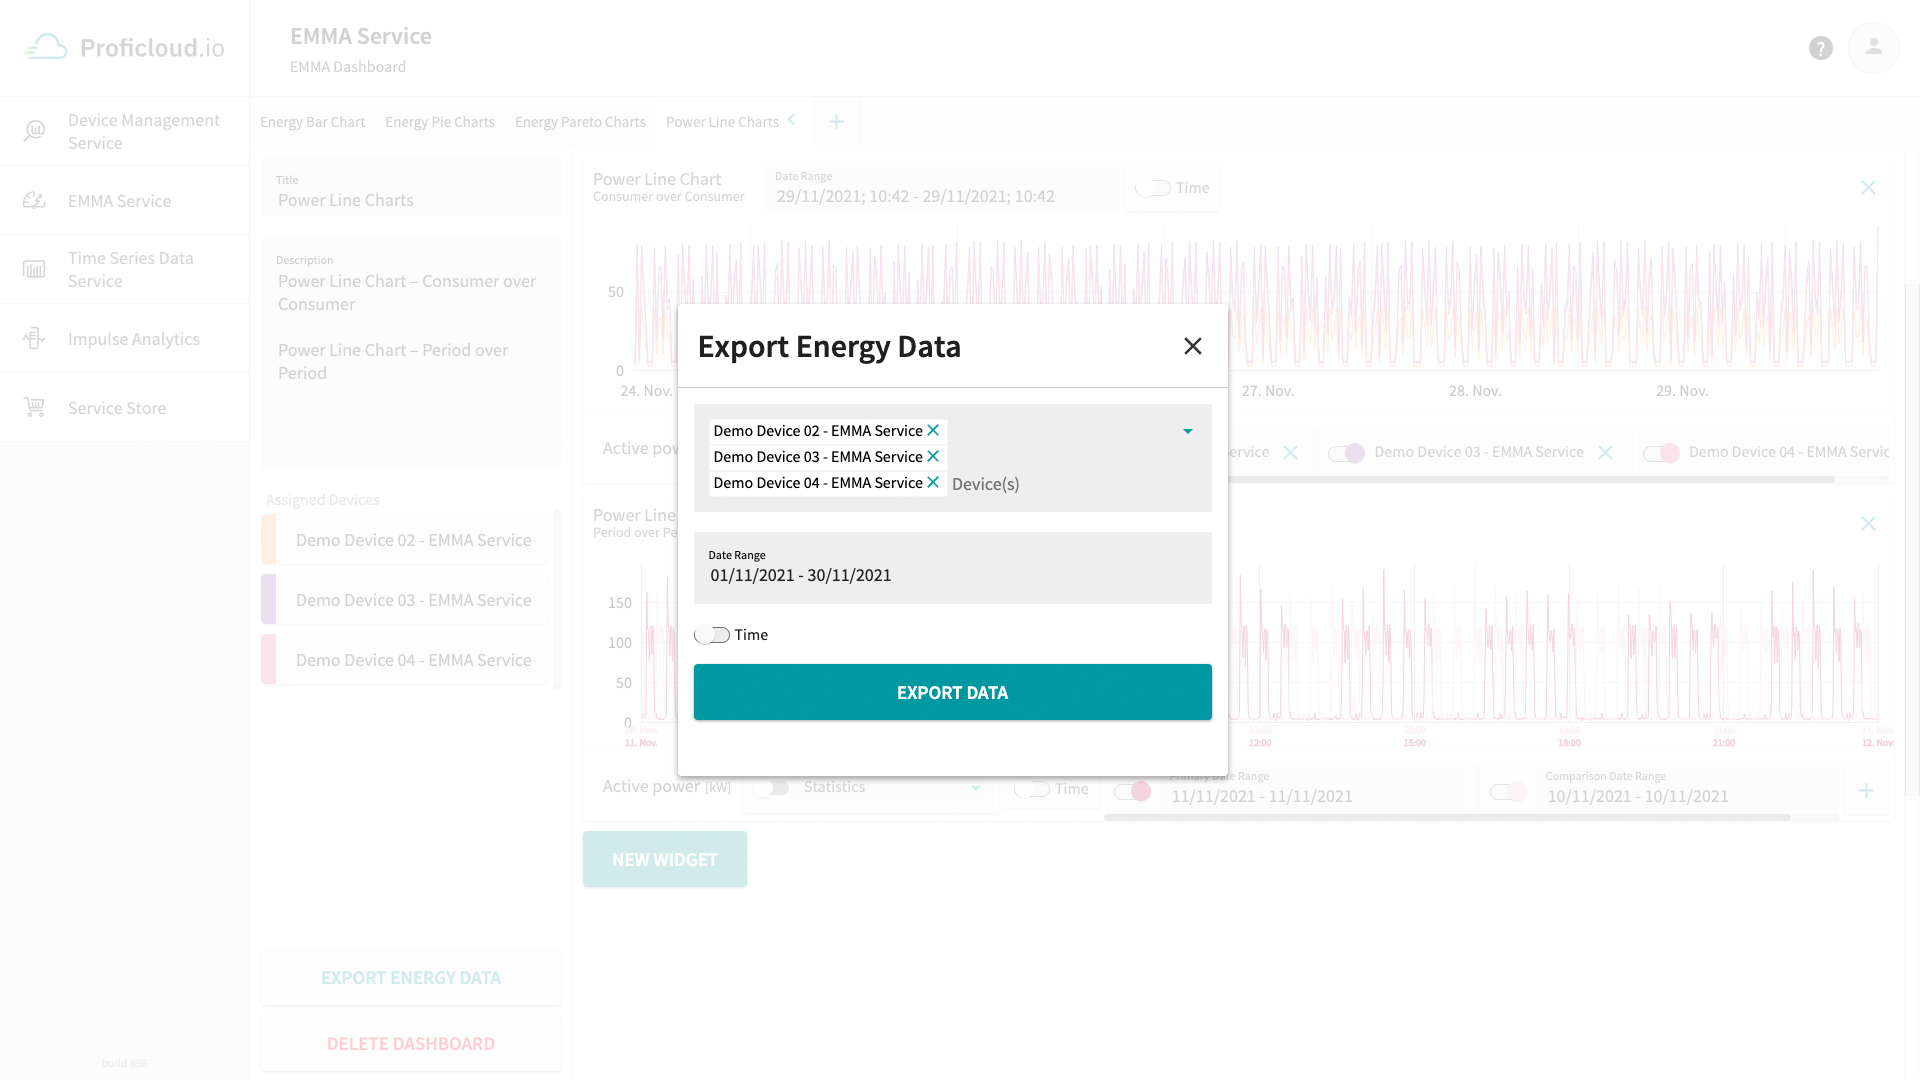
- Export data from dashboards as .csv
- Multiple dashboard availability
- Average line availability in Energy Bar Charts
- Minor bug fixes
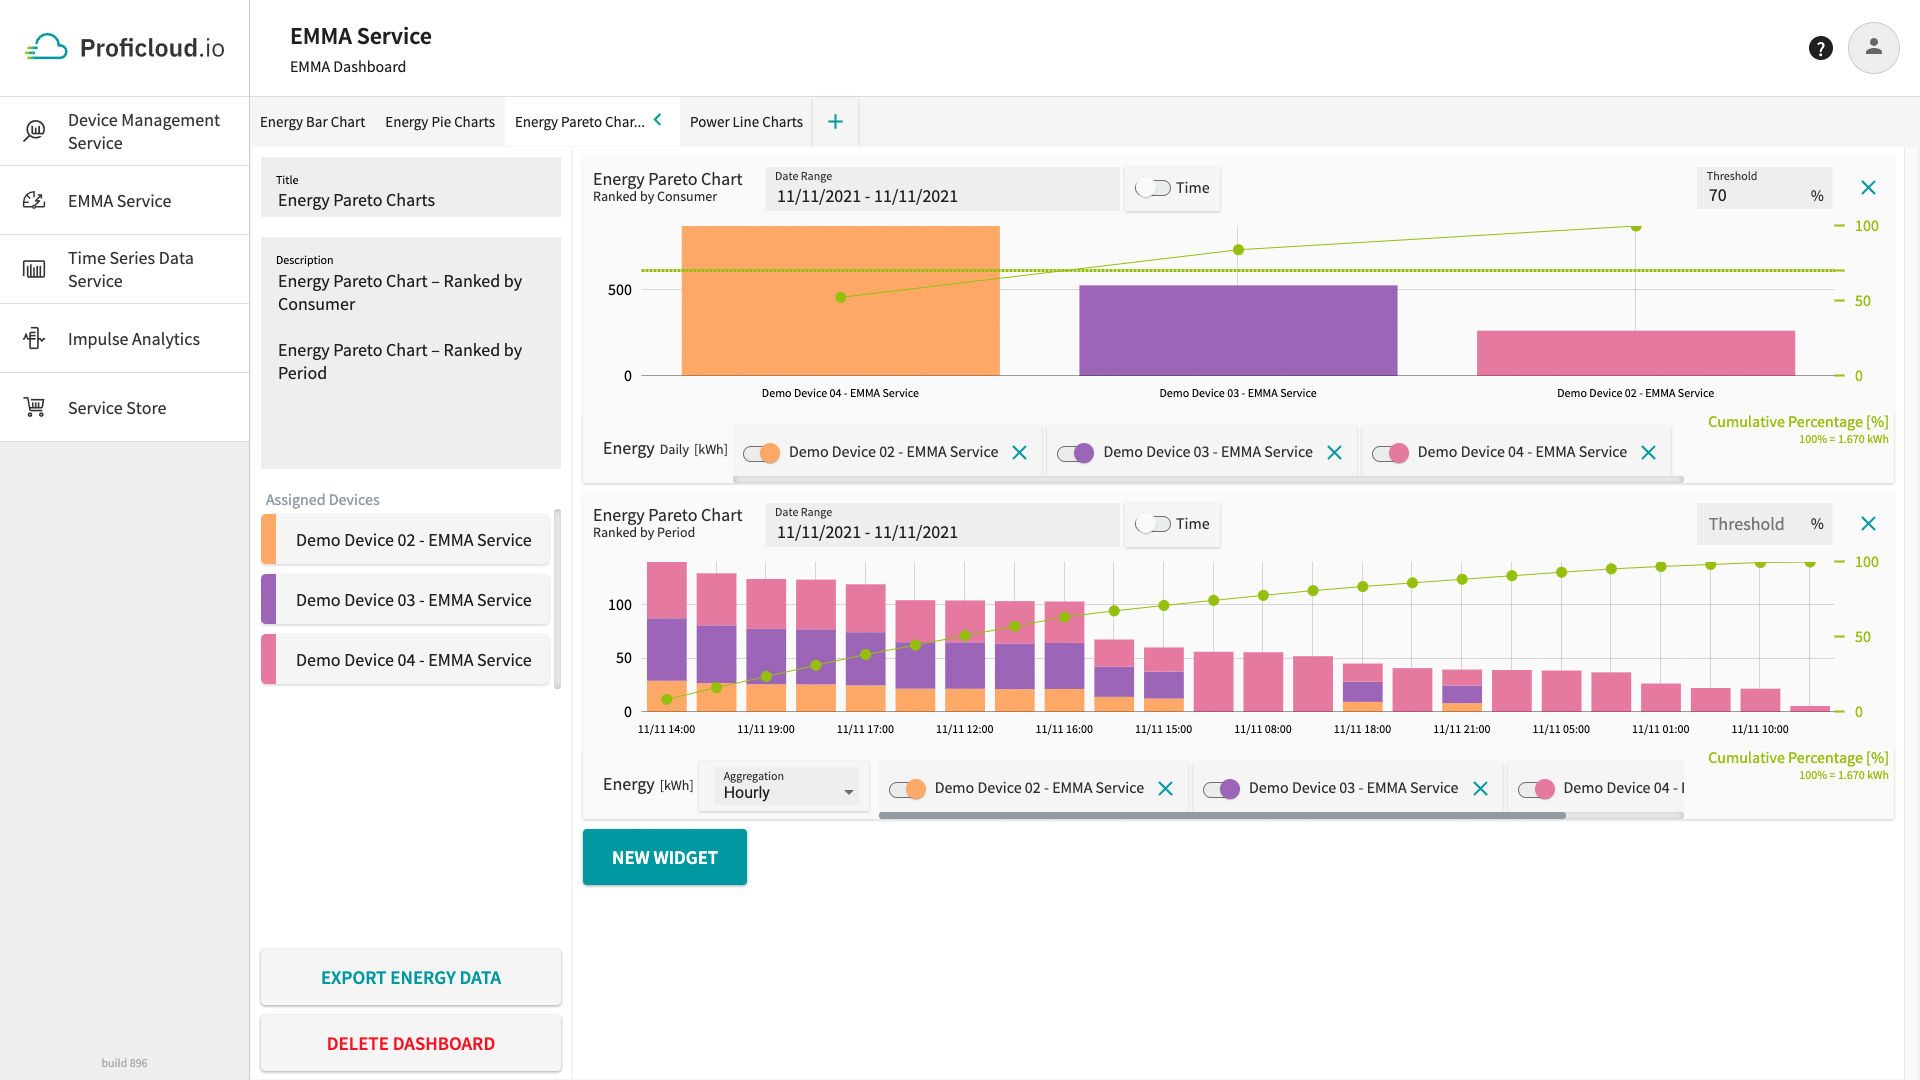
- Visualization Option Enhancement: Energy Pareto Chart – Ranked by Consumer with customizable Cumulative Percentage Threshold setting
- Visualization Option Enhancement: Energy Pareto Chart – Ranked by Period with customizable Cumulative Percentage Threshold setting
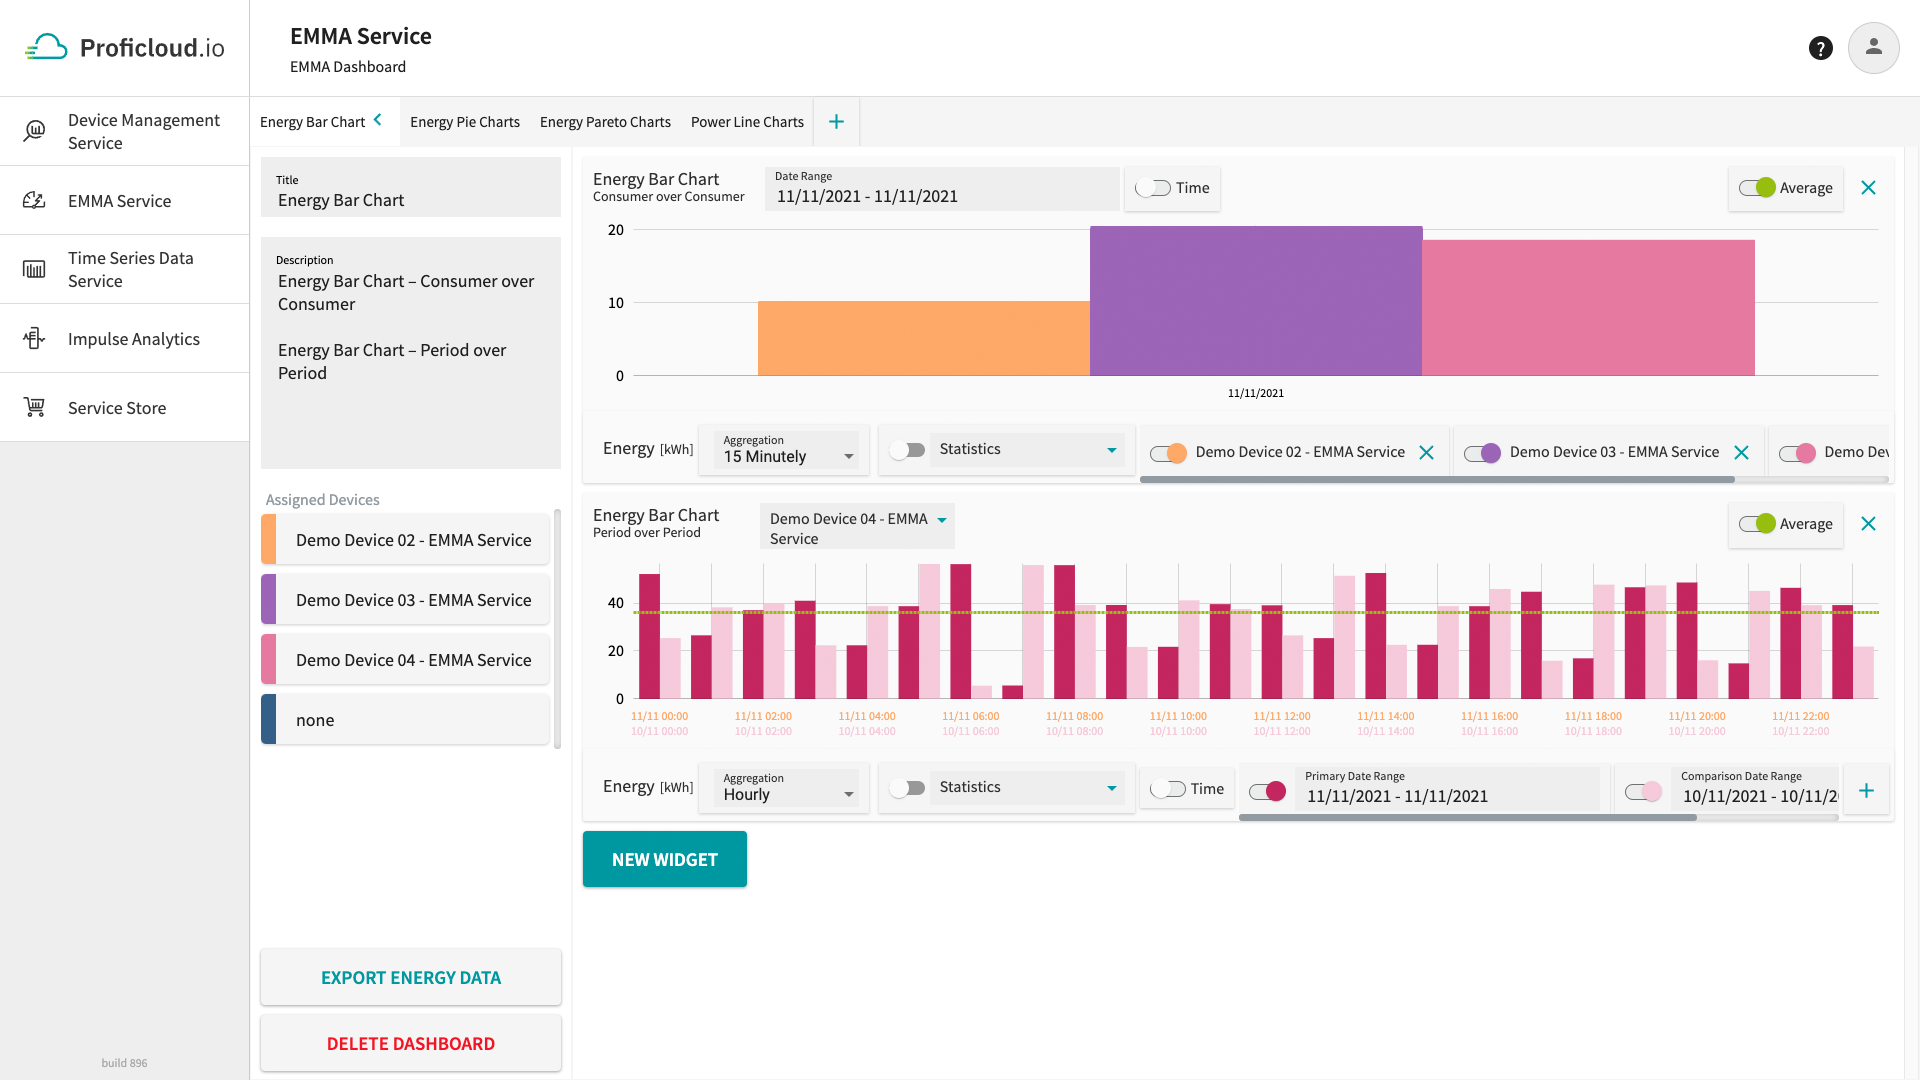
- Visualization Option: Energy Bar Chart – Consumer over Consumer
- Visualization Option: Energy Bar Chart – Period over Period
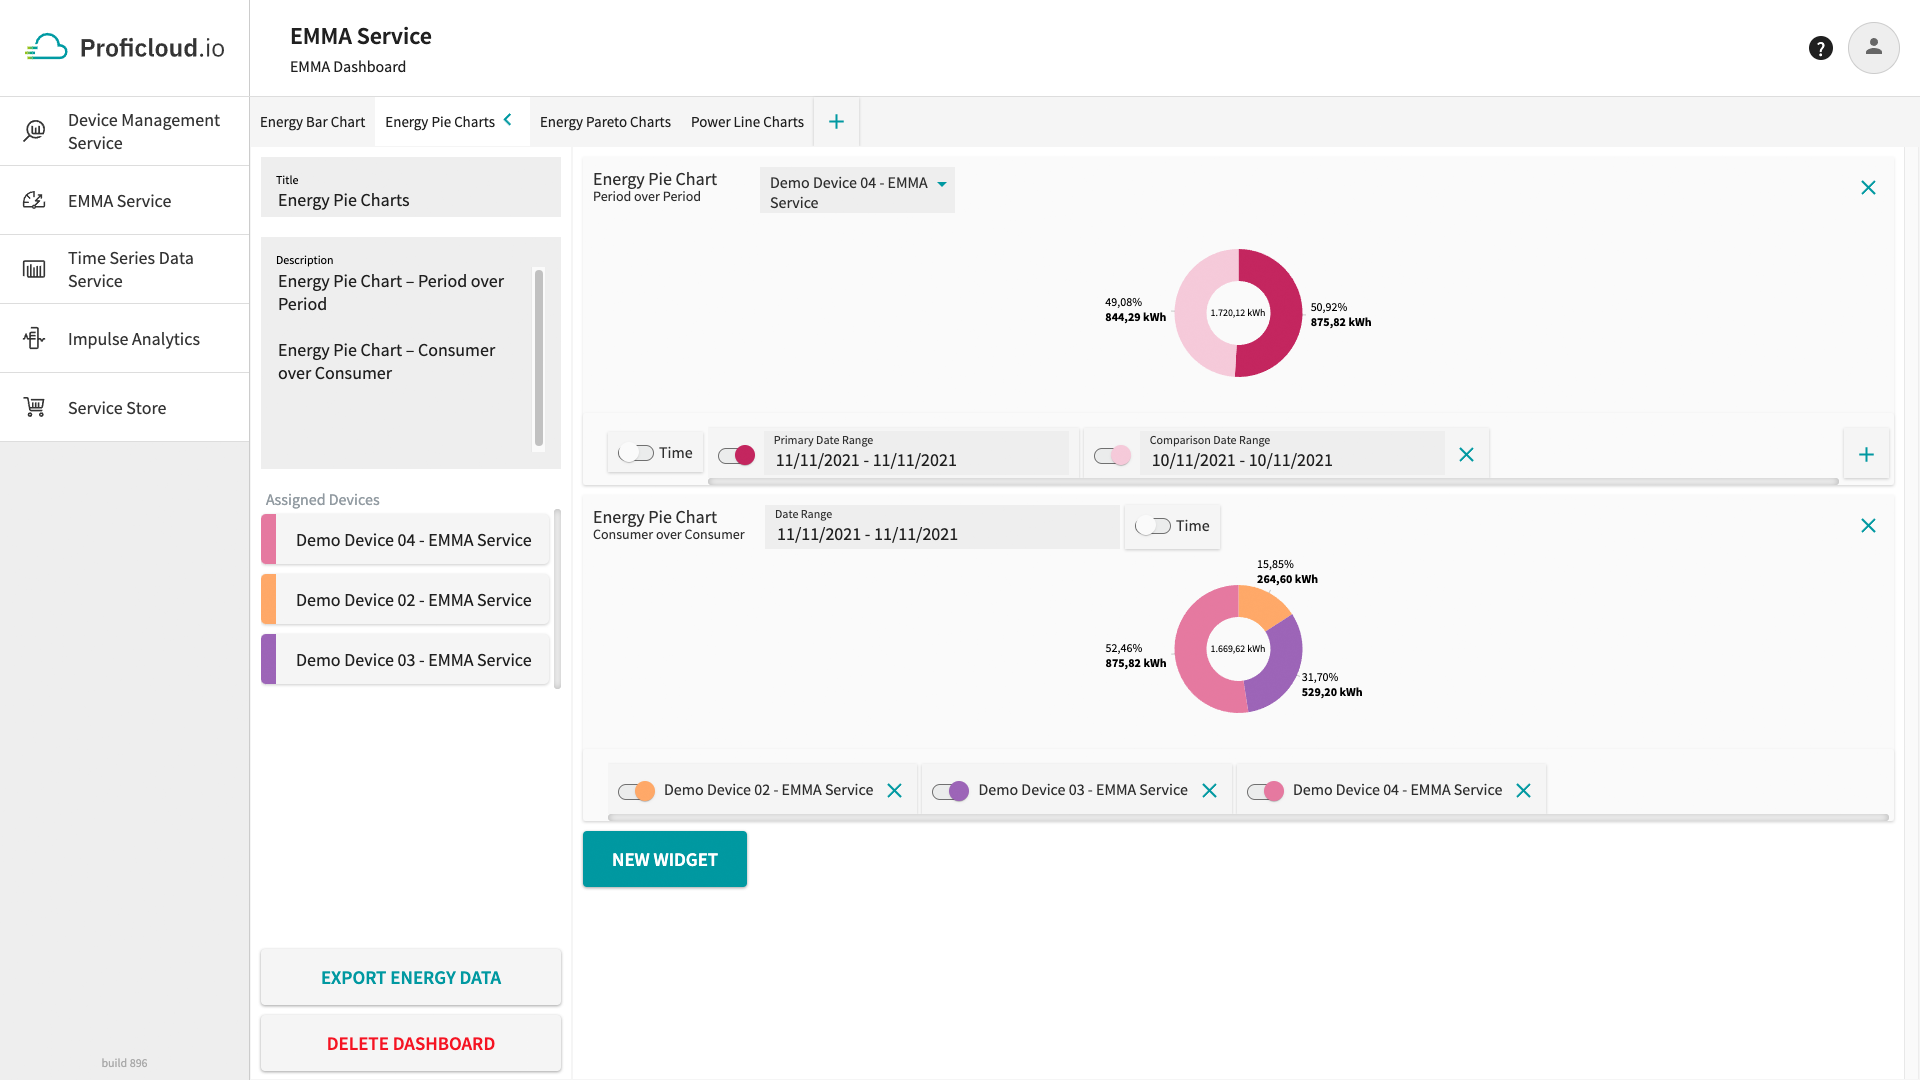
- Visualization Option: Energy Pie Chart – Consumer over Consumer
- Visualization Option: Energy Pie Chart – Period over Period
- Visualization Option: Energy Pareto Chart – Ranked by Consumer
- Visualization Option: Energy Pareto Chart – Ranked by Period
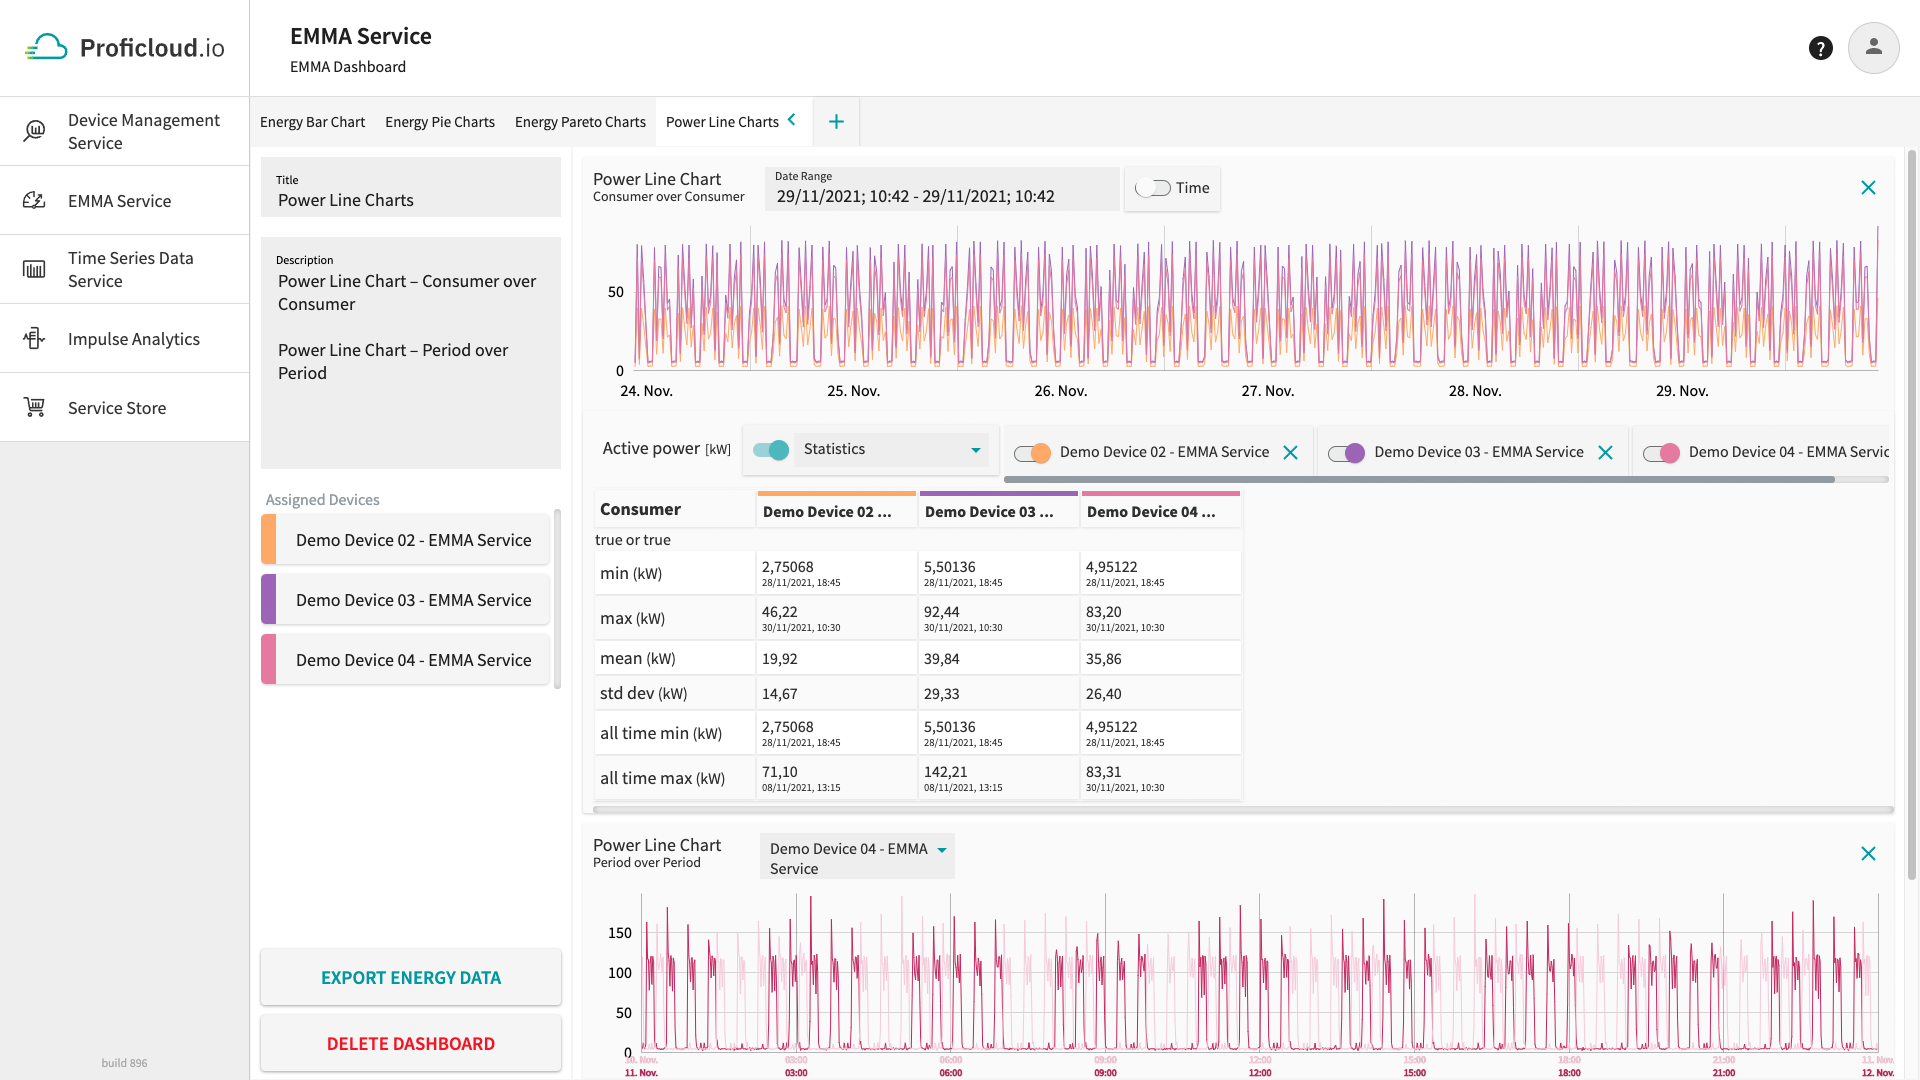
- Visualization Option: Power Line Chart – Consumer over Consumer
- Visualization Option: Power Line Chart – Period over Period
- Statistical Values: Min, Max, Mean, Std. Deviation, All time Max, All Time Min for Energy Bar Charts
- Statistical Values: Min, Max, Mean, Std. Deviation, All time Max, All Time Min for Power Line Charts
About the EMMA Service
The Future of Energy Management
This Smart Service enables remote data access of energy and power data using the IoT-enabled measuring devices of Phoenix Contact in order to monitor, analyse and evaluate this data with the help of diverse visualization options.
Your benefits:
- Save time and improve workflows through remote monitoring and easy-to-understand dashboards that visualize your energy and power data
- Make quicker decisions: Benefit from tailored visualization options for energy and power data analysis and evaluation
- Enable to work safely from remote: View energy data from anywhere at anytime


